
diff options
Diffstat (limited to 'src/third_party/wiredtiger/src/docs/devdoc-perf-flamegraphs.dox')
| -rw-r--r-- | src/third_party/wiredtiger/src/docs/devdoc-perf-flamegraphs.dox | 74 |
1 files changed, 74 insertions, 0 deletions
diff --git a/src/third_party/wiredtiger/src/docs/devdoc-perf-flamegraphs.dox b/src/third_party/wiredtiger/src/docs/devdoc-perf-flamegraphs.dox new file mode 100644 index 00000000000..1e5bc1ad4fd --- /dev/null +++ b/src/third_party/wiredtiger/src/docs/devdoc-perf-flamegraphs.dox @@ -0,0 +1,74 @@ +/*! @page devdoc-perf-flamegraphs CPU Flame Graphs + +# Introduction + +[FlameGraphs](http://www.brendangregg.com/FlameGraphs/cpuflamegraphs.html), +invented by [Brendan Gregg](http://www.brendangregg.com), help visually +summarize on-CPU call stacks. + +Below is an image of a FlameGraph generated from a 10-second run of the +evict-btree-stress-multi wtperf job: + +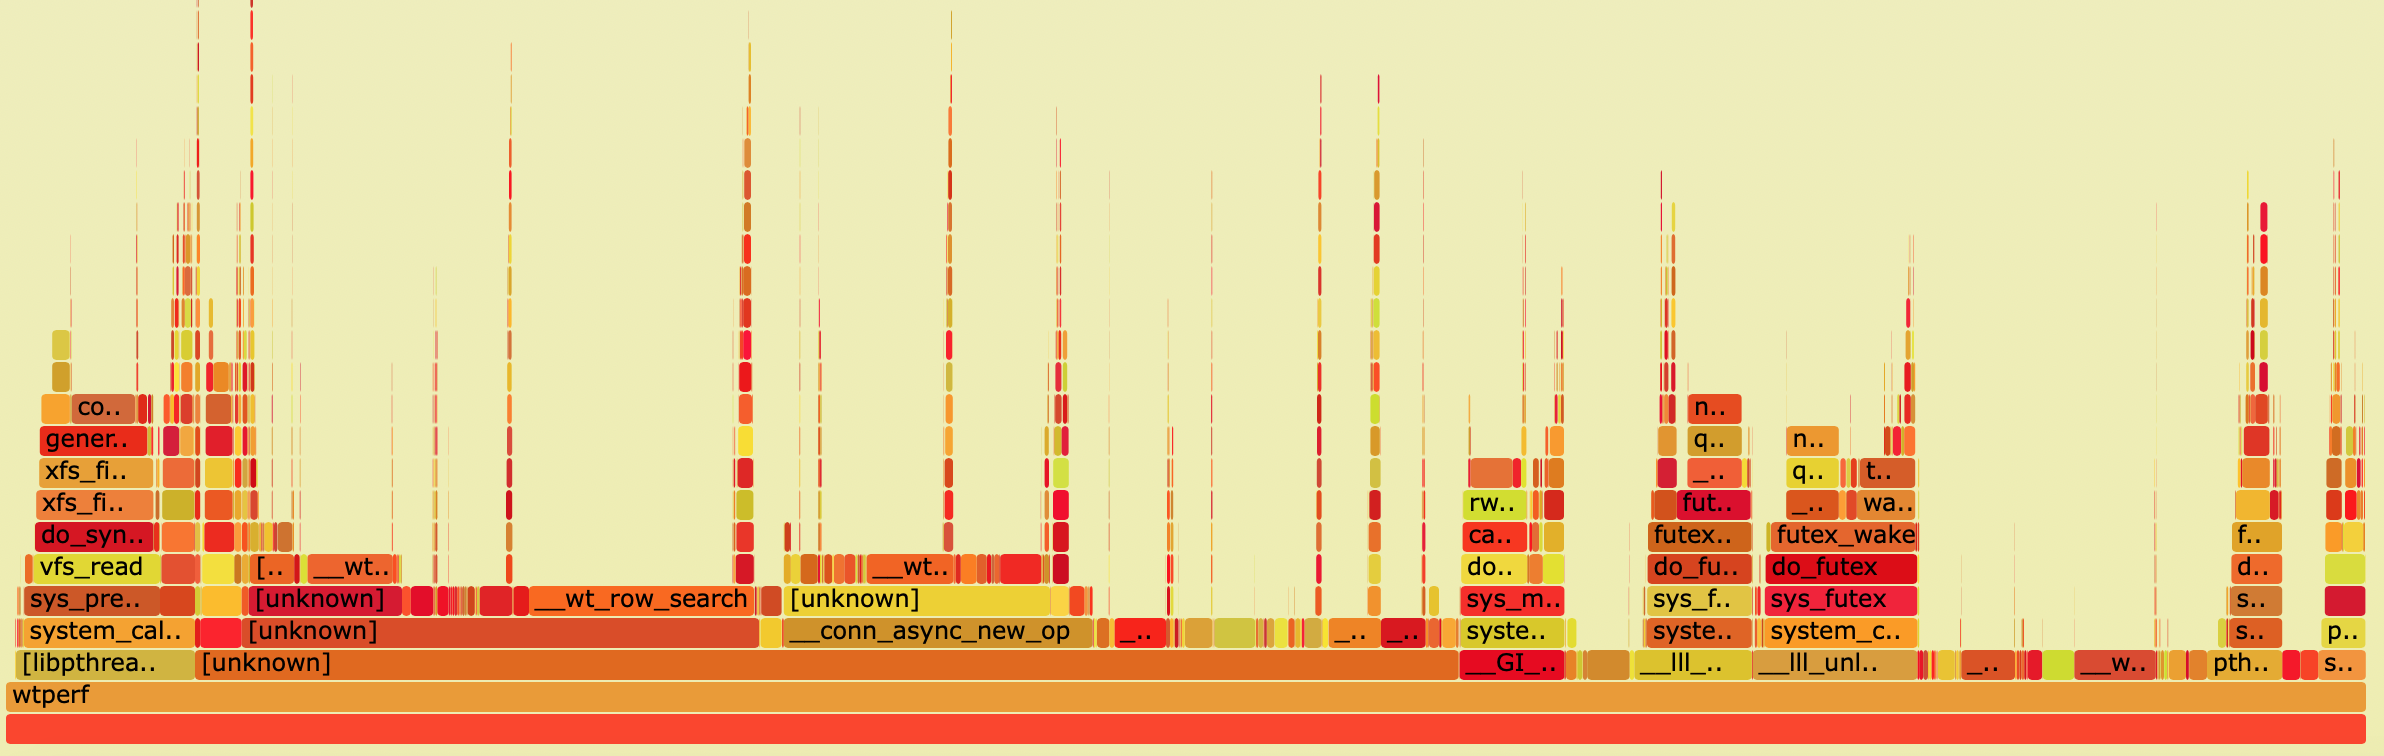 + +To see it in action, download the non-redacted interactive version +[here](https://github.com/wiredtiger/wiredtiger/wiki/images/FlameGraph-evict-stress-multi.svg) +and open it in your web browser. + +Quoting from [Brendan Gregg's +website](http://www.brendangregg.com/FlameGraphs/cpuflamegraphs.html), here is +how to interpret the output of the FlameGraph: + +- Each box represents a function in the stack (a "stack frame"). +- The y-axis shows stack depth (number of frames on the stack). The top box + shows the function that was on-CPU. Everything beneath that is ancestry. The + function beneath a function is its parent, just like the stack traces shown + earlier. (Some flame graph implementations prefer to invert the order and use + an "icicle layout", so flames look upside down.) +- The x-axis spans the sample population. It does not show the passing of time + from left to right, as most graphs do. The left to right ordering has no + meaning (it's sorted alphabetically to maximize frame merging). +- The width of the box shows the total time it was on-CPU or part of an + ancestry that was on-CPU (based on sample count). Functions with wide boxes + may consume more CPU per execution than those with narrow boxes, or, they may + simply be called more often. The call count is not shown (or known via + sampling). + +__Note:__ If you generate a FlameGraph yourself and then open it in a browser, +the image will be interactive, allowing you to hover over the functions to see +their full names. + +# Generating FlameGraphs + +To generate FlameGraphs, you first need to run perf and generate a perf.data +file using the `perf record -g` command. [Click here](@ref devdoc-perf) for +instructions explaining how to do this with WiredTiger. Don't forget the `-g` +option: you need it in order to record the call stacks! + + # Clone the FlameGraph repository + git clone https://github.com/brendangregg/FlameGraph + cd FlameGraph + + # Place perf.data into the current directory, then run these commands. + # Run them on the same machine where you ran `perf record` so perf can + # resolve the symbols. + perf script | ./stackcollapse-perf.pl > out.perf-folded + ./flamegraph.pl out.perf-folded > perf-kernel.svg + +Then open the resultant `svg` file in your web browser. + +Here is another FlameGraph for a full run of the `many-stable-stress.wtperf` +job: + +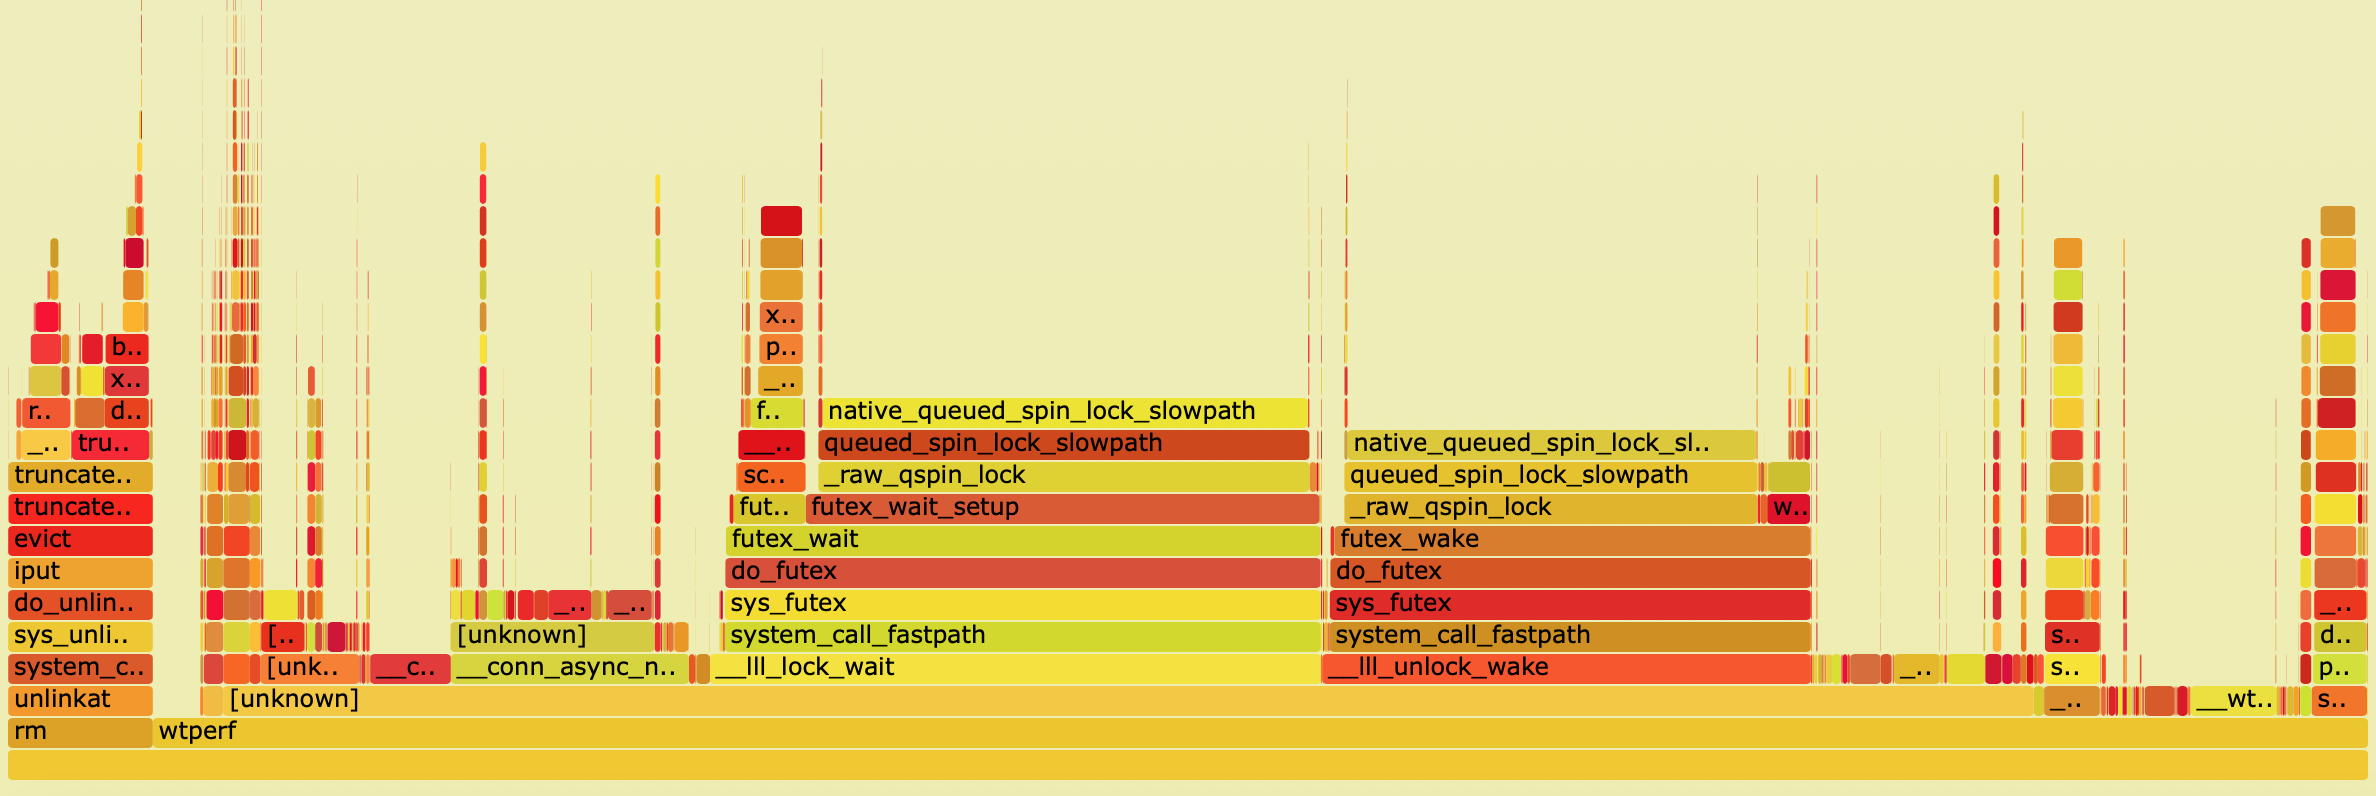 + +Download the non-redacted interactive version +[here](https://github.com/wiredtiger/wiredtiger/wiki/images/FlameGraph-many-tables-stress.svg) +and open it in your web browser. + +If you see 'unknown' call stacks in your FlameGraph, this means that perf could +not resolve the symbols. To fix this, install the versions of the libraries or +the OS kernel with symbols included, link against those libraries and re-gather +the `perf` output. + +*/ |